Where Did the Power Go? The Hidden Currents Sabotaging Your Energy Budget
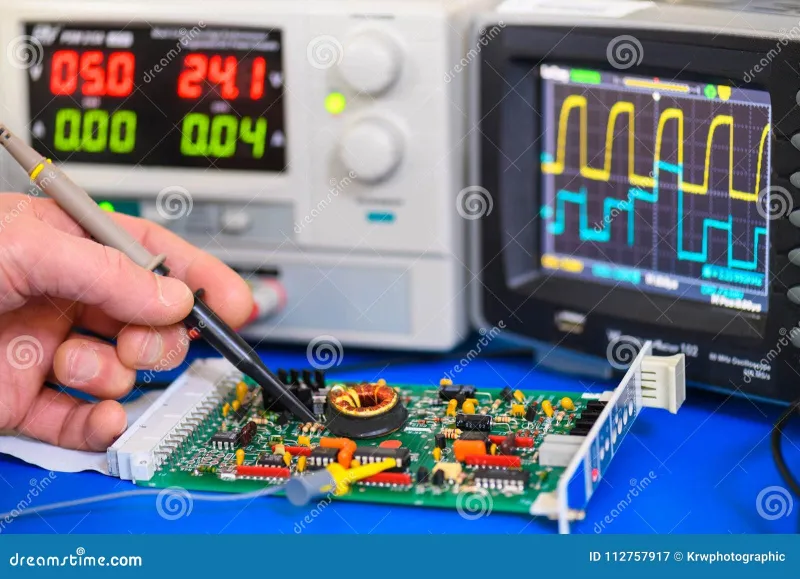
Photo: electronics power measurement oscilloscope circuit board energy consumption, via thumbs.dreamstime.com
Every electronics engineer has been there. The spreadsheet is tidy, the math is sound, and the estimated battery life looks entirely reasonable. Then the prototype lands on the bench, and the measured consumption is 30, 40, sometimes 60 percent higher than the model predicted. The design still functions — but something, somewhere, is quietly consuming energy that was never accounted for.
This is not an unusual experience. It is, in fact, one of the most consistent pain points across product development cycles, from hobbyist microcontroller projects to professional embedded system designs. The reasons are numerous, and most of them trace back to the same fundamental issue: datasheets present ideal or typical values, while real-world circuits operate under conditions that are anything but ideal.
Understanding the mechanisms behind these discrepancies is not merely an academic exercise. For battery-powered devices, IoT sensor nodes, wearable electronics, and any application where energy efficiency is a primary design constraint, closing the gap between estimated and actual consumption can mean the difference between a viable product and one that returns to the drawing board.
The Regulator's Quiet Tax
Linear voltage regulators are among the most frequently underestimated contributors to excess power consumption. Engineers correctly note the quiescent current figure in a datasheet — perhaps a few microamps for a modern low-dropout device — and factor it into their budget accordingly. What often gets overlooked is how quiescent current behaves across the full range of operating conditions.
Many LDO regulators exhibit significantly higher quiescent draw when the input-to-output voltage differential increases, when load current fluctuates rapidly, or when operating at temperature extremes. The datasheet figure is typically measured under a specific, favorable set of conditions. In a real design where input voltage sags under load or rises during charging, the regulator's actual consumption may diverge substantially from that published number.
Switching regulators introduce a different category of loss. Conversion efficiency curves published in datasheets are often measured at the regulator's optimal load current — a point that conveniently flatters the device's performance. At light loads, which are common in systems that spend most of their time in standby, efficiency can drop considerably. A buck converter rated at 90 percent efficiency at 500 mA may deliver only 70 percent efficiency at 5 mA, a reality that compounds poorly when the application spends 95 percent of its operating time in a low-activity state.
Switching Losses Are Not Free
In digital systems and power electronics alike, every transition between logic states carries an energy cost. This switching loss is proportional to frequency, load capacitance, and supply voltage — a relationship captured in the familiar dynamic power equation. What engineers sometimes underestimate is the cumulative effect of these transitions across an entire system.
Consider a microcontroller driving a display, communicating over SPI, and sampling an analog sensor — all simultaneously. Each peripheral bus has capacitance. Each GPIO toggle dissipates energy in proportion to that capacitance and the square of the supply voltage. The individual contributions appear negligible in isolation. Aggregated across millions of transitions per second, they can represent a meaningful fraction of total system consumption.
High-speed interfaces are particularly significant in this regard. USB, Ethernet PHYs, and even moderately fast I²C buses running at 400 kHz all contribute dynamic losses that rarely receive individual line items in a power budget. Factoring in realistic activity duty cycles for each interface, rather than assuming worst-case or zero consumption, produces a more accurate aggregate estimate.
Standby Modes That Are Not Truly Standby
Modern microcontrollers and system-on-chip devices advertise impressively low sleep-mode current figures — single-digit microamps in many cases. These numbers are accurate under carefully controlled conditions: specific peripherals disabled, clocks gated, I/O pins configured correctly, and no unintended leakage paths active.
In practice, achieving datasheet sleep-mode consumption requires deliberate and often painstaking configuration work. A single GPIO pin left floating and connected to an input buffer can allow the input to oscillate between logic levels, causing continuous switching current. An I²C pull-up resistor left powered while the bus is idle creates a continuous current path. An analog comparator left enabled in sleep mode consumes its own quiescent current regardless of whether the main processor core is halted.
External components connected to a sleeping microcontroller can be equally problematic. Sensors, memory devices, and communication modules frequently draw milliamps in their own idle states unless explicitly powered down or placed into their lowest-power modes through software. In many designs, the peripheral ecosystem consumes far more energy during system sleep than the microcontroller itself.
Measurement Techniques That Reveal the Truth
Correcting for these discrepancies begins with measurement — specifically, measurement at a resolution and timescale appropriate to the behavior being observed. A standard benchtop multimeter in series with the power supply provides average current, which is useful but often insufficient for diagnosing dynamic power issues.
A digital oscilloscope with a high-resolution current probe or a precision shunt resistor in the supply path reveals the current waveform over time. This approach makes sleep-mode spikes visible — the brief current surges that occur when a microcontroller services a real-time clock interrupt, refreshes a watchdog timer, or handles a peripheral event. These spikes are narrow in duration but can be substantial in amplitude, and their average contribution to total consumption is easily underestimated without waveform-level visibility.
Dedicated power analyzers and specialized tools such as the Nordic Power Profiler or Otii Arc provide high dynamic range measurement specifically designed for embedded system power profiling. These instruments log current over time with sufficient resolution to correlate consumption spikes with specific firmware events, making it straightforward to identify which code paths or peripheral activities are responsible for excess draw.
Building a More Honest Power Model
The most effective power budgets treat consumption as a statistical model rather than a static sum. Rather than assigning a single current value to each component, a realistic model defines the current consumption in each operating state, the time fraction spent in each state, and the transition costs between states.
This state-based approach forces the designer to account for the full activity profile of the system. A temperature sensor that wakes every 30 seconds, takes a measurement, transmits data over a radio link, and returns to sleep has at least four distinct current states, each with a defined duration and consumption. Modeling each state explicitly — including the regulator efficiency at the corresponding load level — produces a far more accurate energy estimate than simply adding typical current values from individual datasheets.
Prototype validation should then compare measured state currents against modeled values before any manufacturing commitment is made. Discrepancies identified at this stage are inexpensive to address. Those discovered after production begins are not.
Closing the Gap
The divergence between estimated and actual power consumption is not an unavoidable mystery. It is the predictable result of models that rely on idealized datasheet values without accounting for the real-world conditions under which circuits actually operate. Voltage regulators draw more than their quiescent current figures suggest. Switching losses accumulate across every active interface. Standby modes deliver their advertised performance only when every peripheral and pin configuration is explicitly managed.
Developers who build measurement discipline into their prototyping workflow — profiling current at the waveform level, correlating spikes with firmware activity, and validating state-based power models before finalizing designs — consistently produce more accurate estimates and more energy-efficient products. The power was never truly missing. It simply needed to be found.